Bar Chart vs Line Graph: Which Should You Choose?
Use a bar chart to compare distinct categories. Use a line graph to show a pattern across an ordered sequence, often time, when connecting neighbouring observations is meaningful. Choose by what the data represents and the question you want to answer.
What will you learn?
- Choose a chart for categories or an ordered time sequence
- Read values and changes from a line graph
- Explain what the connections between points imply
When should you use a bar chart?
A bar chart compares values attached to categories: favourite book genres, types of transport or survey choices. The bar lengths show the values, and gaps separate the categories. Start the value axis at zero when bar length is intended to represent magnitude.
You can often reorder nominal categories without changing their meaning. Ordering genres by popularity may make comparisons easier. Ordered categories, such as age bands or a rating scale, should usually keep their meaningful order.
When should you use a line graph?
A line graph connects observations across a meaningful sequence. Dates and times must stay in order. A rising segment means the next recorded value is higher; a falling segment means it is lower. A line joining two observations does not prove the exact values at every unmeasured point between them.
For equally spaced daily observations, equally spaced horizontal positions are appropriate. For irregular dates, use proportional time spacing or label the axis clearly enough to show that points are categorical observations. Missing data is not a measured zero: mark gaps or explain any decision to join across them.
Compare favourite genres with bars
Thirty-six fictional readers each choose one favourite genre: fiction 12, mystery 8, science 10 and poetry 6. These are categories rather than successive points in time.
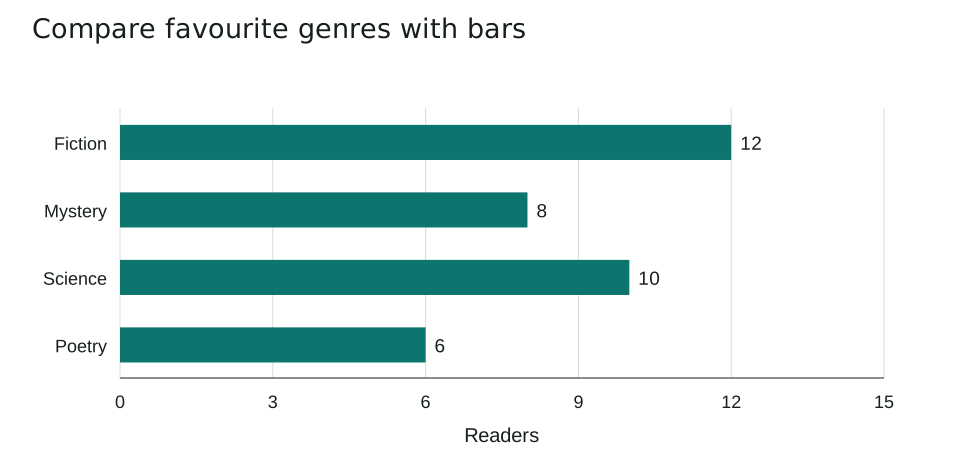
| Genre | Readers |
|---|---|
| Fiction | 12 |
| Mystery | 8 |
| Science | 10 |
| Poetry | 6 |
Fiction has the most votes, 12, and poetry has the fewest, 6. The difference is 12 - 6 = 6 readers. Science and mystery together account for 10 + 8 = 18 readers, half of the sample.
Joining these categories with a line would suggest a sequence from fiction through poetry that the survey has not defined. Separate bars let the reader compare category counts directly.
Follow library borrowing over a week
A separate fictional dataset records loans on five consecutive weekdays: Monday 12, Tuesday 18, Wednesday 15, Thursday 24 and Friday 21. A line graph highlights the ordered changes.
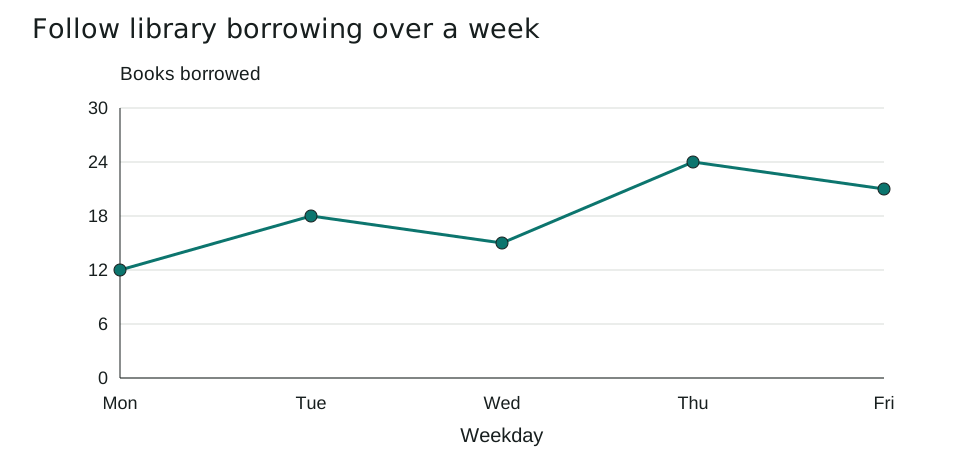
| Day | Books borrowed |
|---|---|
| Monday | 12 |
| Tuesday | 18 |
| Wednesday | 15 |
| Thursday | 24 |
| Friday | 21 |
The largest increase is from Wednesday to Thursday: 24 - 15 = 9 books. The highest recorded day is Thursday. Friday is lower than Thursday but still 21 - 12 = 9 books above Monday.
Keep the days in chronological order. Sorting them by loan count would destroy the time pattern. A bar chart would also be valid for comparing the daily totals; the line is useful here because changes across consecutive days are the focus.
Which mistakes should you avoid?
- Connecting unordered category names as though they form a numerical sequence.
- Sorting time observations by their measured value.
- Treating a missing observation as zero or as a known value on a connecting line.
Five practice questions
Use the worked examples above. Try the questions before opening the answers.
- Which chart would you choose for favourite genres, and why?
- How many more readers choose fiction than poetry?
- On which day are the most books borrowed?
- What is the largest increase between consecutive days?
- Would sorting the weekdays from lowest to highest loan count preserve the time pattern? Explain.
Show answers and working
- A bar chart: genres are distinct categories, and separate bars compare their counts without implying a time sequence.
- 12 - 6 = 6 readers.
- Thursday, with 24 books.
- From Wednesday to Thursday, loans increase from 15 to 24: an increase of 9 books.
- No. The time pattern depends on chronological order. Sorting by count changes which days are neighbours and misrepresents the sequence.
Common questions
Can a bar chart show data over time?
Yes. Bars can compare daily or monthly totals. A line graph is useful when the pattern of change across the ordered observations is the main focus.
Must a line graph always start its vertical axis at zero?
Not always, but any restricted range must be clear and appropriate. Readers should be able to judge the absolute change from labelled axis values.
Printable worksheet and teacher answers
The A4 worksheet contains the two examples, five practice questions with writing space, and a separate answer page. Print pages 1-2 for students and retain page 3 for marking. Suggested time: 25 minutes.
Download worksheet and answers (PDF)Free to print and share for classroom and home learning. All examples use original fictional data and contain no real pupil information.