Misleading Graphs: Seven Common Mistakes and How to Spot Them
A graph can use correct numbers yet give a misleading impression through its scale, chart type, labels or missing context. Check the axis baseline, intervals, units, full data range and source before accepting the visual message.
What will you learn?
- Separate visual exaggeration from the numerical change
- Identify seven common graph-design problems
- Redesign a comparison with a clear scale and context
Which seven mistakes should you look for?
1. A truncated bar axis makes bar lengths start above zero and can exaggerate a difference. 2. Unequal numerical intervals drawn at equal distances distort the scale. 3. A restricted date range can hide a longer-term pattern. 4. Missing units or a vague title can conceal what was measured.
5. Pictures or 3D shapes scaled in both height and width can exaggerate a change through area or volume. 6. An unsuitable chart type, such as pie slices for overlapping groups, changes the meaning of the comparison. 7. Missing source, sample-size or denominator information can make a small or selective dataset look more general than it is.
A graph does not need to be intentionally deceptive to be misleading. Explain the specific design choice and its effect. A tightly focused axis in a line graph may be useful for small changes when the limits are obvious; bar length comparisons usually need a zero baseline.
How do you check a claim behind a graph?
Read the numbers as well as the shapes. Calculate the absolute difference, then divide by the original value if you need a percentage change. Ask whether the same units, groups and time periods are being compared.
Look for the full table and a description of how the data was collected. A precise-looking chart cannot repair an unrepresentative sample. When evidence is missing, describe what the graph shows and what you cannot establish from it.
Two accurate counts, an exaggerated impression
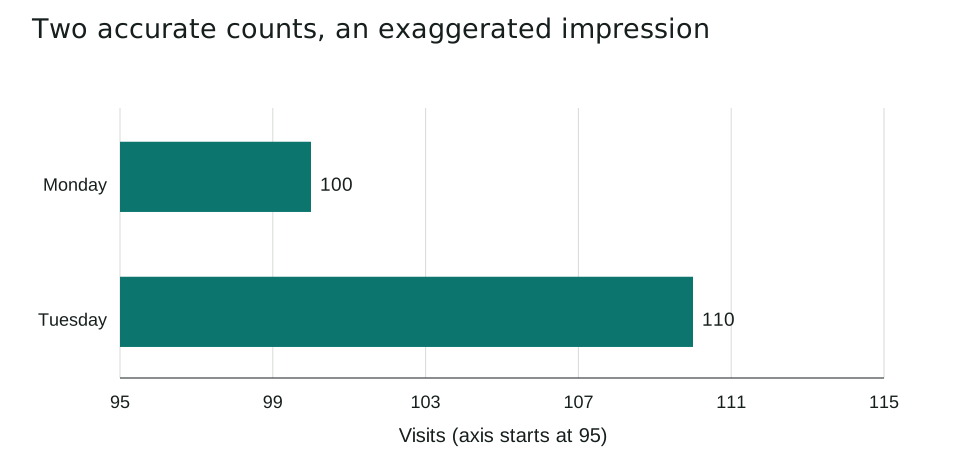
A fictional library records 100 visits on Monday and 110 on Tuesday. This deliberately problematic bar chart starts its horizontal axis at 95 instead of zero.
| Day | Visits |
|---|---|
| Monday | 100 |
| Tuesday | 110 |
The visible lengths run from 95 to 100 and from 95 to 110. They therefore measure 5 and 15 axis units: the second looks three times as long. The true counts are 100 and 110, not 5 and 15.
The absolute increase is 110 - 100 = 10 visits. The percentage increase is 10 / 100 x 100 = 10%. It is not a tripling of the number of visits. The axis labels reveal the issue, but the bar lengths still encourage an exaggerated comparison.
Redraw the same data with a zero baseline
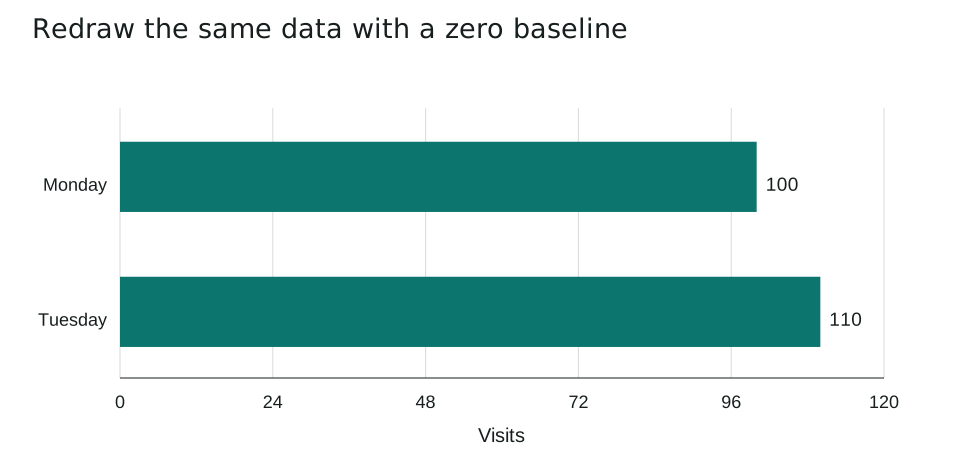
Use exactly the same counts, title and units, with the horizontal axis running from zero to 120. No observations have been removed or changed.
| Quantity | Calculation | Result |
|---|---|---|
| Absolute increase | 110 - 100 | 10 visits |
| Percentage increase | 10 / 100 x 100 | 10% |
| Tuesday / Monday | 110 / 100 | 1.1 |
With a zero baseline, the bar-length ratio agrees with the count ratio, 110 / 100 = 1.1. The chart shows a modest increase rather than an apparent tripling.
The comparison still covers only two days. It cannot establish that visits have increased over a month or explain why Tuesday was busier. A fair scale and a careful written claim are both needed.
Which mistakes should you avoid?
- Judging a percentage increase from the apparent bar-length ratio without reading the baseline.
- Assuming that a clearer redesign proves a causal explanation.
- Calling every non-zero line-graph axis deceptive without considering its labels and purpose.
Five practice questions
Use the worked examples above. Try the questions before opening the answers.
- What is the absolute increase in library visits from Monday to Tuesday?
- Calculate the percentage increase using Monday as the baseline.
- Why does the truncated chart make Tuesday's bar look three times as long?
- Does a zero-baseline chart of these two days prove that visits are increasing over the whole year?
- Name two checks besides the axis baseline that would help you assess a graph.
Show answers and working
- 110 - 100 = 10 visits.
- (110 - 100) / 100 x 100 = 10%.
- Its baseline is 95. The visible lengths are 100 - 95 = 5 and 110 - 95 = 15; 15 / 5 = 3, which is not the ratio of the actual counts.
- No. It describes only two days. A yearly trend requires observations covering a suitable longer period.
- Examples include checking units, equal scale intervals, the complete time range, the source, sample size, denominator, and whether the chart type fits the data.
Common questions
Are the numbers always wrong in a misleading graph?
No. The numbers can be accurate while the visual presentation or missing context encourages an unsupported conclusion.
Is every graph with a restricted axis misleading?
No. Consider the chart type and purpose. A clearly labelled restricted line-graph range can show small changes; bar-length comparisons usually call for zero.
Printable worksheet and teacher answers
The A4 worksheet contains the two examples, five practice questions with writing space, and a separate answer page. Print pages 1-2 for students and retain page 3 for marking. Suggested time: 30 minutes.
Download worksheet and answers (PDF)Free to print and share for classroom and home learning. All examples use original fictional data and contain no real pupil information.