Scatter Plots and Correlation: Worked Examples and Practice Questions
A scatter plot places one point for each pair of numerical measurements. An upward pattern suggests positive correlation; a downward pattern suggests negative correlation. Correlation describes an association and does not, by itself, establish cause and effect.
What will you learn?
- Plot and read paired numerical data
- Describe the direction and strength of a pattern
- Separate correlation from evidence of causation
How do you read a scatter plot?
Choose one variable for the horizontal x-axis and the other for the vertical y-axis. A point at (3, 49) means that the same observation has x = 3 and y = 49. Keep the original pairs together: sorting the x and y columns separately destroys the relationship.
Describe direction first, then how tightly points follow the pattern. Positive means y tends to increase as x increases; negative means y tends to decrease. A tight downward pattern can be a strong relationship. The word negative describes direction, not poor quality or weakness.
What does no correlation mean?
If points form a loose cloud without a clear upward or downward pattern, there may be little linear correlation. Look for curves, separate clusters and unusual points before concluding that the variables have no relationship at all.
A correlation coefficient summarises a linear association, but a plot helps reveal features that one number can hide. This lesson uses visual descriptions rather than a threshold that labels every dataset as strong or weak.
Study time and quiz score
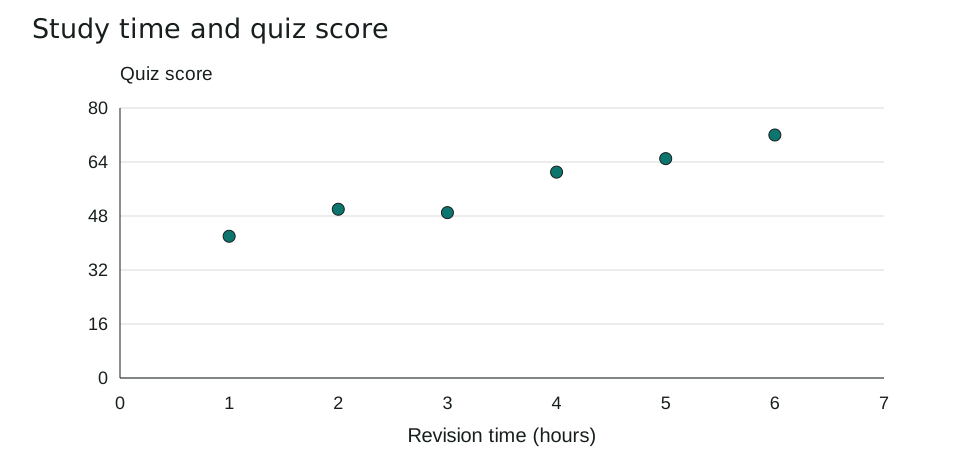
Six fictional pupils report revision time before the same quiz. Each row is one pupil; the scores are out of 100.
| Hours | Quiz score |
|---|---|
| 1 | 42 |
| 2 | 50 |
| 3 | 49 |
| 4 | 61 |
| 5 | 65 |
| 6 | 72 |
The point (4, 61) represents four hours of revision and a score of 61. Overall, larger revision times go with larger scores, so the pattern shows positive correlation.
The pupil who revised for three hours scored slightly lower than the pupil who revised for two hours. Correlation does not require every successive point to increase. This small invented dataset cannot establish how much extra revision causes a score to change.
A downward pattern can be strong
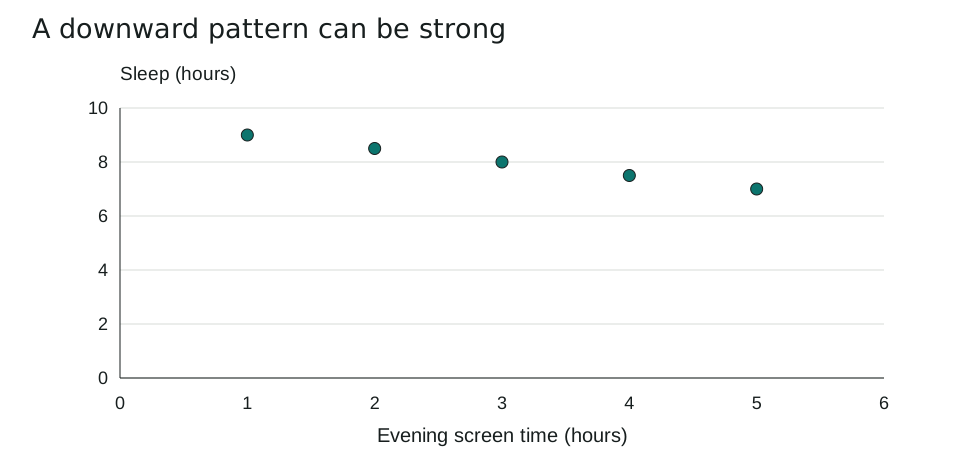
This deliberately simple fictional example pairs evening screen time with hours of sleep. It illustrates direction; it is not a health study.
| Screen time (hours) | Sleep (hours) |
|---|---|
| 1 | 9 |
| 2 | 8.5 |
| 3 | 8 |
| 4 | 7.5 |
| 5 | 7 |
As x increases, y decreases. These invented points lie exactly on a downward straight line, making the visual relationship strong and negative.
A real investigation would need a suitable sample and information about other explanations, such as schedules or age. An observed relationship alone cannot tell us whether changing one variable would change the other. Avoid predicting far beyond the observed range: a line extended to extreme values may become unreasonable.
Which mistakes should you avoid?
- Separating measurements that belong to the same observation.
- Interpreting negative correlation as a weak relationship.
- Claiming causation, or extrapolating far beyond the observed values.
Five practice questions
Use the worked examples above. Try the questions before opening the answers.
- What does the point (4, 61) mean in the revision example?
- Describe the overall direction of the revision-score relationship.
- Is the screen-time example positive or negative? Is its visual pattern weak or strong?
- Must every point rise as x increases for a positive correlation to exist? Use example 1.
- Does the first scatter plot prove that an extra hour of revision causes a higher score? Explain.
Show answers and working
- One fictional pupil revised for 4 hours and scored 61 on the quiz.
- Positive: quiz score tends to increase as revision time increases.
- It is negative and visually strong. The points lie exactly along a downward straight line.
- No. The score falls from 50 at 2 hours to 49 at 3 hours, while the overall pattern still rises.
- No. It shows an association in six fictional observations. Other factors and the study design would need investigation before making a causal claim.
Common questions
Should I connect all the points?
Usually no. A scatter plot shows paired observations, not an ordered journey through them. A fitted line is different from joining consecutive points.
Can a curved relationship have little linear correlation?
Yes. A coefficient for linear association can miss a strong curved pattern, which is one reason to inspect the plotted data.
Printable worksheet and teacher answers
The A4 worksheet contains the two examples, five practice questions with writing space, and a separate answer page. Print pages 1-2 for students and retain page 3 for marking. Suggested time: 25 minutes.
Download worksheet and answers (PDF)Free to print and share for classroom and home learning. All examples use original fictional data and contain no real pupil information.