How to Read a Box Plot: Worked Examples and Practice Questions
A box plot summarises a numerical dataset using its median, quartiles and whiskers. The box shows the middle 50% of values. In a modified box plot, observations beyond the 1.5 x IQR fences appear as separate potential outliers.
What will you learn?
- Identify the median, quartiles and interquartile range
- Distinguish a whisker endpoint from an outlier
- Compare two distributions using the same scale
What do the parts of a box plot mean?
The line inside the box marks the median: the middle of the sorted observations. The left edge is the lower quartile, Q1, and the right edge is the upper quartile, Q3. Their difference, Q3 - Q1, is the interquartile range, or IQR. A wider box means more spread across the middle half of the data.
A modified box plot draws whiskers to the most extreme observed values within its outlier fences. Values below Q1 - 1.5 x IQR or above Q3 + 1.5 x IQR are plotted separately. A fence is a calculated cutoff; a whisker is an actual observation. An outlier flag is a reason to investigate a value, not proof that it is wrong.
Which quartile method are we using?
This lesson uses exclusive median of halves. Sort the values, find the overall median, then leave that median out of both halves when the dataset has an odd number of observations. Q1 and Q3 are the medians of those halves. For an even-sized list, divide it into equal halves.
Other courses and software use inclusive halves or interpolation. State the method and keep it consistent when comparing datasets. In small samples, a different method can change the box edges and outlier flags.
Read one class's scores
These nine fictional scores are out of 100. They are already sorted: 42, 48, 50, 52, 56, 60, 62, 64, 96.
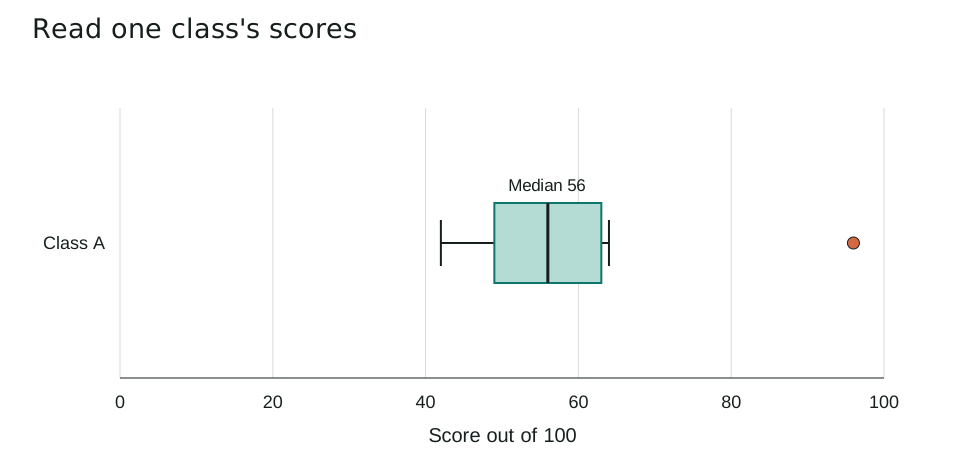
| Statistic | Value |
|---|---|
| Q1 | 49 |
| Median | 56 |
| Q3 | 63 |
| IQR | 14 |
| Lower / upper fence | 28 / 84 |
| Whiskers | 42 / 64 |
| Potential outlier | 96 |
The fifth value is 56, so the median is 56. The lower half is 42, 48, 50, 52, giving Q1 = (48 + 50) / 2 = 49. The upper half is 60, 62, 64, 96, giving Q3 = (62 + 64) / 2 = 63.
IQR = 63 - 49 = 14. The fences are 49 - 21 = 28 and 63 + 21 = 84. The score 96 lies above 84, so it is marked separately. The upper whisker ends at 64, the largest observed score within the fences.
Compare two classes fairly
A separate fictional class has scores 40, 44, 46, 48, 52, 56, 58, 60, 62. Both groups use the same assessment and the same horizontal scale.
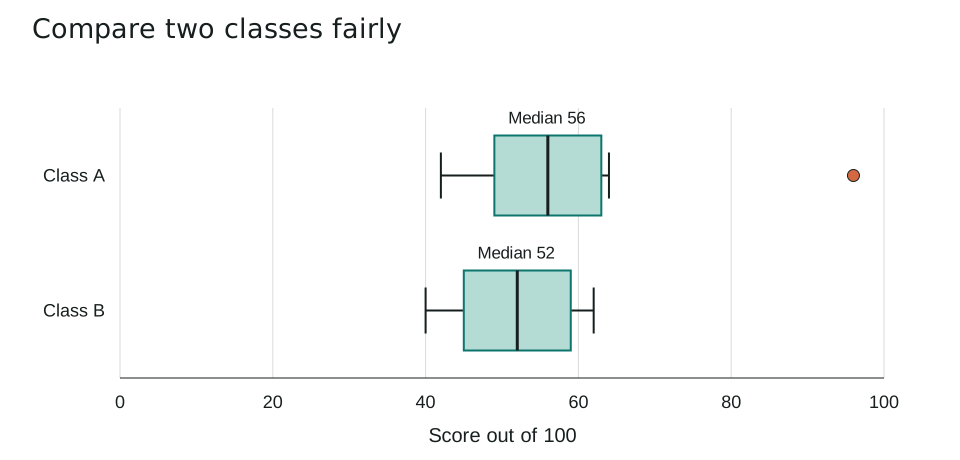
| Class | Q1 | Median | Q3 | IQR |
|---|---|---|---|---|
| A | 49 | 56 | 63 | 14 |
| B | 45 | 52 | 59 | 14 |
Class A has a median 4 points higher: 56 - 52 = 4. Both IQRs equal 14, so their middle halves have the same spread. The unusually high score in A does not make its middle box wider.
You cannot recover every individual score, a precise mean, or a cause for the difference from the box plots alone. A higher median does not mean every member of A scored higher than every member of B.
Which mistakes should you avoid?
- Calling the upper whisker the maximum when a separate outlier is present.
- Comparing boxes drawn on different scales without checking the axes.
- Treating a potential outlier as an automatic data-entry error.
Five practice questions
Use the worked examples above. Try the questions before opening the answers.
- What is the median score for Class A? Explain how to locate it in the raw data.
- Calculate Class A's IQR using the stated quartile method.
- Is 96 a potential outlier in Class A? Show the upper-fence calculation.
- Which class has the higher median, and which has the larger IQR?
- Why does Class A's upper whisker stop at 64 instead of 84 or 96?
Show answers and working
- 56. There are nine sorted values, so the fifth value is the median.
- Q1 = 49 and Q3 = 63, so IQR = 63 - 49 = 14 points.
- Yes. The upper fence is 63 + 1.5 x 14 = 84. Since 96 > 84, it is a potential outlier.
- Class A has the higher median, 56 versus 52. Neither has a larger IQR: both are 14.
- 64 is the largest observed value within the upper fence. 84 is only a calculated cutoff; 96 is outside it and is drawn separately.
Common questions
Does a box plot show the mean?
The central line shows the median. Some tools can add a mean marker, but a standard box alone does not provide the exact mean.
Can two box plots have the same IQR but different medians?
Yes. The box width describes middle spread, while the median describes centre. These are different features of a distribution.
Printable worksheet and teacher answers
The A4 worksheet contains the two examples, five practice questions with writing space, and a separate answer page. Print pages 1-2 for students and retain page 3 for marking. Suggested time: 30 minutes.
Download worksheet and answers (PDF)Free to print and share for classroom and home learning. All examples use original fictional data and contain no real pupil information.