Mean vs Median: Which Average Should You Use?
The mean is the sum of the values divided by their count. The median is the middle of the sorted values. Extreme observations can pull the mean strongly, so the median is often useful when describing a typical value in a skewed dataset.
What will you learn?
- Calculate the mean and median
- Explain how an extreme value affects each average
- Choose an average that fits a clearly stated question
How do you calculate mean and median?
For the arithmetic mean, add every observation and divide by the number of observations. Keep repeated values: each recorded observation contributes to the sum and the count. The mean need not be a value that actually appears in the list.
For the median, sort the data first. With an odd number of values, choose the single middle value. With an even number, average the two middle values. Do not take the middle of an unsorted input list or confuse the median with the midpoint between the minimum and maximum.
Which average answers your question?
The mean uses the size of every value and is useful when totals matter. The median depends on position and is less sensitive to the size of an extreme observation. For a skewed distribution of journey times, reporting the median alongside the mean can explain why the typical journey feels different from the overall average.
Neither statistic is automatically the right choice. State what the values describe, whether there are unusual observations, and what you mean by typical. Include units and a measure of spread. Never remove an inconvenient extreme value merely to make the averages agree.
Five similar journey times
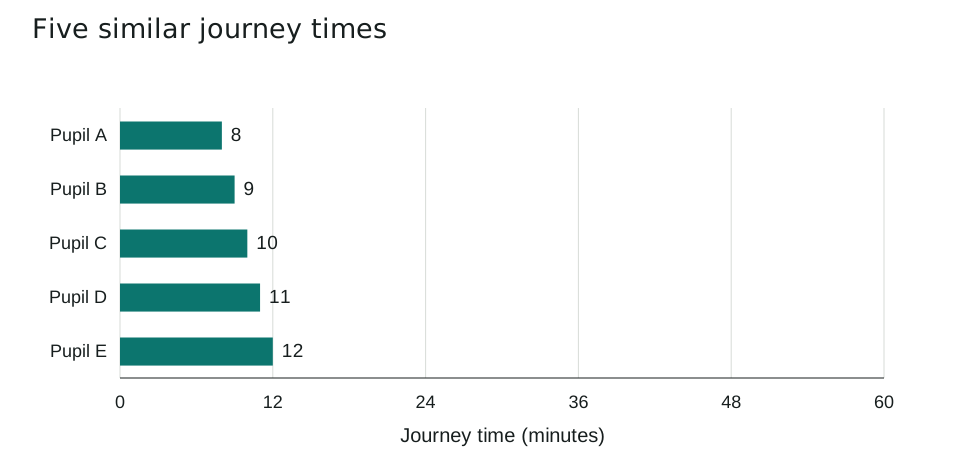
Five fictional pupils have journey times of 8, 9, 10, 11 and 12 minutes. Each labelled bar is one pupil's measurement, rather than a histogram bin.
| Pupil | Minutes |
|---|---|
| A | 8 |
| B | 9 |
| C | 10 |
| D | 11 |
| E | 12 |
The sum is 8 + 9 + 10 + 11 + 12 = 50 minutes. The mean is 50 / 5 = 10 minutes. The third value in the sorted list is also 10, so the median is 10 minutes.
The two averages agree here, but that does not make them interchangeable. The range is 12 - 8 = 4 minutes, describing a feature of the spread that neither average shows.
Change one observation
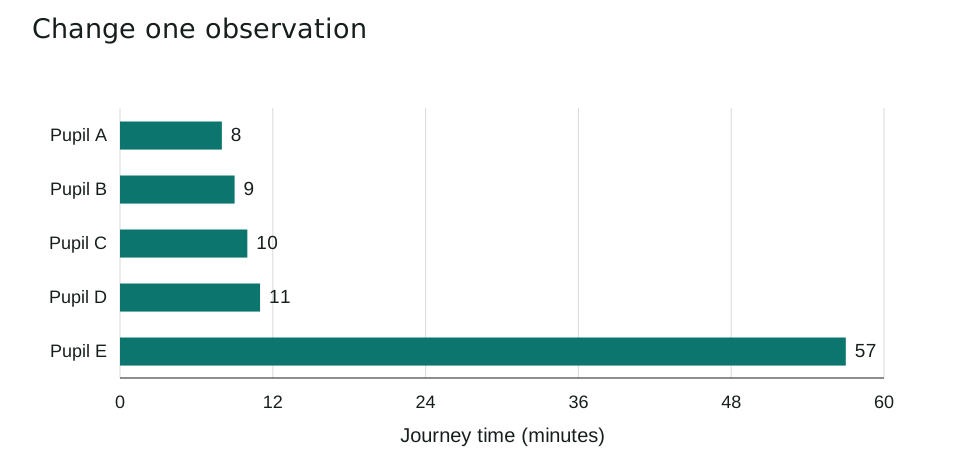
Now replace the final journey time of 12 minutes with 57 minutes. All other values stay the same. This is a second fictional dataset, shown on the same scale.
| Dataset | Sum | Mean | Median |
|---|---|---|---|
| 8, 9, 10, 11, 12 | 50 | 10 | 10 |
| 8, 9, 10, 11, 57 | 95 | 19 | 10 |
The new sum is 95, so the mean is 95 / 5 = 19 minutes. The median remains the third value, 10. Increasing one observation by 45 increases the mean by 45 / 5 = 9 minutes.
The 57-minute observation contributes to total travel time and must not be silently discarded. For these five pupils, 10 minutes describes the middle journey, while 19 minutes is the total divided evenly across them. Reporting both makes the effect of the unusually long journey clear.
Which mistakes should you avoid?
- Finding the median before sorting the values.
- Calling the mean the most common value; that is the mode.
- Deleting extreme observations without a documented reason.
Five practice questions
Use the worked examples above. Try the questions before opening the answers.
- Find the mean of 8, 9, 10, 11 and 12 minutes.
- Find the median of 8, 9, 10, 11 and 57 minutes.
- How much does the mean increase when 12 is replaced by 57?
- Find the median of 4, 7, 9 and 20.
- For the second journey dataset, which average would you report to describe the middle pupil's journey, and what extra context would you include?
Show answers and working
- The sum is 50 and there are 5 observations. Mean = 50 / 5 = 10 minutes.
- The values are sorted and the third value is 10. The median is 10 minutes.
- The mean increases from 10 to 19 minutes, an increase of 9 minutes. Equivalently, (57 - 12) / 5 = 9.
- There are four sorted values, so average the middle two: (7 + 9) / 2 = 8.
- Use the median of 10 minutes for the middle journey. Also report the mean of 19 minutes or the unusually long 57-minute journey so the variation is visible.
Common questions
Is the median always better than the mean?
No. The choice depends on the question, distribution and purpose. The median describes a middle position; the mean connects directly to the total.
Can changing an extreme value change the median?
Yes, if the change alters the middle positions or their values. In our example it stays the largest observation, so the middle value is unchanged.
Printable worksheet and teacher answers
The A4 worksheet contains the two examples, five practice questions with writing space, and a separate answer page. Print pages 1-2 for students and retain page 3 for marking. Suggested time: 25 minutes.
Download worksheet and answers (PDF)Free to print and share for classroom and home learning. All examples use original fictional data and contain no real pupil information.