Stem-and-Leaf Plots: A Step-by-Step Guide with Practice Questions
A stem-and-leaf plot splits each numerical value into a stem and a final digit called a leaf. With a clear key, it shows the distribution while preserving the individual observations. Sort the leaves and keep repeated values.
What will you learn?
- Build a plot from a sorted numerical list
- Read values using the key and leaf unit
- Find counts, medians and ranges from a plot
How do you build a stem-and-leaf plot?
Start by sorting the values. For two-digit integers with a leaf unit of 1, use the tens digit as the stem and the units digit as the leaf. Write each leaf on its stem's row, in increasing order. A repeated observation needs a repeated leaf.
Include a key such as 2 | 4 = 24. Without a key, a reader cannot know whether the same symbols represent 24, 2.4 or another scale. Preserve the measurement units in the title or accompanying description.
Why use a stem-and-leaf plot?
Unlike a histogram, a stem-and-leaf plot can retain the exact recorded values while making clusters and gaps visible. Count the leaves to check the sample size, then read the sorted observations to find the median and range.
The display is most convenient for a reasonably short list with manageable precision. A huge list or many digits can become difficult to read. Do not round away digits without explaining the change; a histogram or box plot may be clearer for a larger dataset.
Plot eleven quiz scores
Use these fictional scores: 12, 14, 14, 18, 21, 23, 24, 27, 31, 33, 36. The leaf unit is 1.
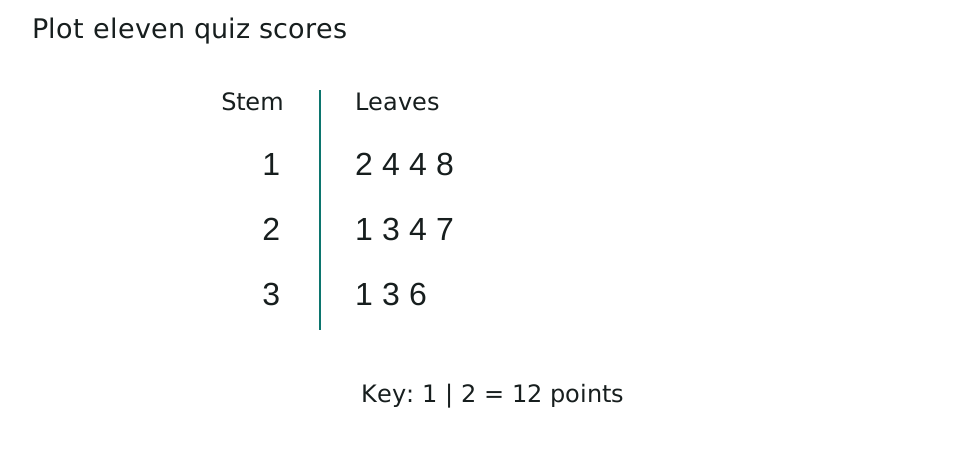
| Stem | Leaves | Number of values |
|---|---|---|
| 1 | 2 4 4 8 | 4 |
| 2 | 1 3 4 7 | 4 |
| 3 | 1 3 6 | 3 |
The two leaves of 4 in the first row preserve both scores of 14. There are 4 + 4 + 3 = 11 leaves, matching the eleven observations.
The median is the sixth value, 23. The smallest score is 12 and the largest is 36, giving a range of 36 - 12 = 24 points. These calculations use the key, not the stem alone.
Read decimal values with a different key
Six fictional task times are 1.2, 1.4, 1.4, 1.8, 2.1 and 2.3 minutes. Here the leaf unit is 0.1 minute.
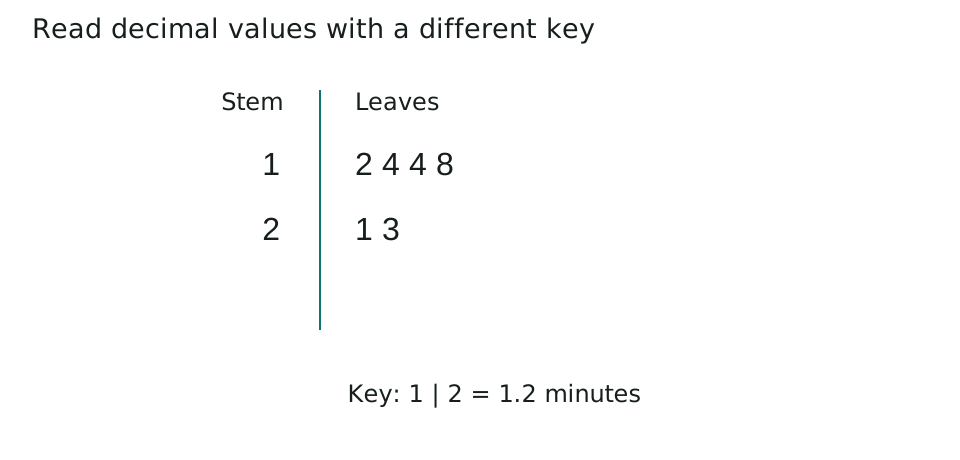
| Entry | Actual time (minutes) |
|---|---|
| 1 | 2 | 1.2 |
| 1 | 8 | 1.8 |
| 2 | 1 | 2.1 |
| 2 | 3 | 2.3 |
The entry 2 | 1 means 2.1 minutes, not 21 minutes. Although some stems and leaves look like the first example, their numerical meaning differs because the key differs.
There are six observations, so the median is the average of the third and fourth values: (1.4 + 1.8) / 2 = 1.6 minutes. The range is 2.3 - 1.2 = 1.1 minutes.
Which mistakes should you avoid?
- Omitting the key or assuming every leaf represents one whole unit.
- Dropping repeated leaves and therefore changing the dataset.
- Writing leaves in input order instead of numerical order.
Five practice questions
Use the worked examples above. Try the questions before opening the answers.
- Using the integer key, what value does 2 | 7 represent?
- How many observations are in the integer plot?
- Find the median and range of the integer scores.
- Why must the two scores of 14 both appear in the first row?
- Using the decimal key, find the median of the six task times.
Show answers and working
- 27 points, because the stem represents tens and the leaf represents units.
- 11: there are four leaves on stem 1, four on stem 2 and three on stem 3.
- The sixth value is 23, so the median is 23 points. The range is 36 - 12 = 24 points.
- Each leaf represents one observation. Using only one leaf of 4 would remove one recorded score and reduce the count.
- The third and fourth sorted times are 1.4 and 1.8 minutes. Their average is (1.4 + 1.8) / 2 = 1.6 minutes.
Common questions
Is a stem-and-leaf plot the same as a histogram?
No. A correctly keyed stem-and-leaf plot retains individual recorded values. A histogram groups values into intervals and shows their frequencies.
Can a stem-and-leaf plot contain decimals?
Yes. Choose and state an appropriate leaf unit, such as 0.1, and provide a key that shows how to reconstruct a value.
Printable worksheet and teacher answers
The A4 worksheet contains the two examples, five practice questions with writing space, and a separate answer page. Print pages 1-2 for students and retain page 3 for marking. Suggested time: 25 minutes.
Download worksheet and answers (PDF)Free to print and share for classroom and home learning. All examples use original fictional data and contain no real pupil information.