Pie Chart Angles and Percentages: Step-by-Step Worked Examples
To draw a pie chart, divide each category's frequency by the total. Multiply that fraction by 100 for its percentage or by 360 for its sector angle. The categories must be non-overlapping parts of the same whole.
What will you learn?
- Convert frequencies to fractions, percentages and angles
- Recover a frequency from an angle and a known total
- Check that categories form one complete whole
How do you calculate a pie chart angle?
First add the category frequencies to find the total. For one category, calculate frequency / total. Its percentage is that fraction multiplied by 100; its angle is that fraction multiplied by 360 degrees. Keep the unrounded fraction during your calculation and round only the displayed result when necessary.
Check the whole: the fractions should sum to 1, the percentages to 100%, and the angles to 360 degrees before rounding. Small discrepancies can arise from rounded labels, but a large discrepancy often means a category is missing, duplicated or calculated from the wrong total.
When is a pie chart appropriate?
Use a pie chart for parts of a clearly defined whole. A survey where each person chooses one favourite fruit fits. A survey where people can select several fruits does not form mutually exclusive slices unless you change what the whole represents and explain it.
A sector shows a proportion, not the sample size by itself. The same 25% slice could describe 5 out of 20 people or 50 out of 200. For close comparisons between categories, a bar chart can make the differences easier to judge.
Turn twenty fruit votes into sectors
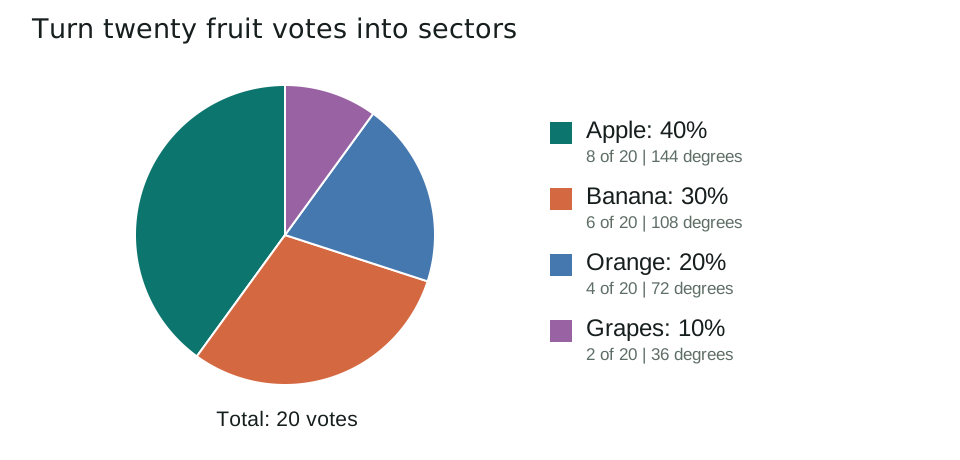
Twenty fictional pupils each choose one favourite fruit: apple 8, banana 6, orange 4 and grapes 2. The total is 20, and every pupil belongs to exactly one category.
| Fruit | Frequency | Percentage | Angle |
|---|---|---|---|
| Apple | 8 | 40% | 144 degrees |
| Banana | 6 | 30% | 108 degrees |
| Orange | 4 | 20% | 72 degrees |
| Grapes | 2 | 10% | 36 degrees |
For apple, the fraction is 8 / 20 = 0.4. Percentage = 0.4 x 100 = 40%. Angle = 0.4 x 360 = 144 degrees. Repeat the same method for every category.
The angle check is 144 + 108 + 72 + 36 = 360 degrees. The apple and banana votes together make 14 / 20 = 70% of the class, represented by 252 degrees.
Work backwards from a sector angle
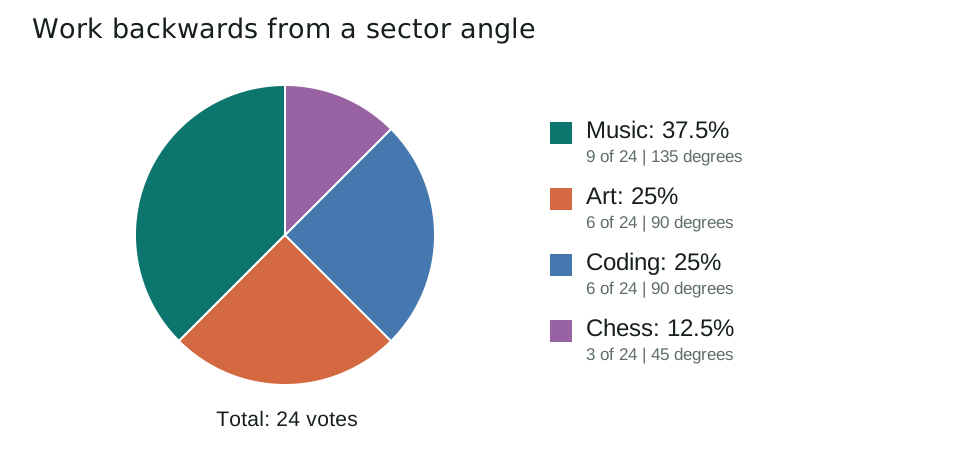
A different fictional group of 24 pupils chooses one club each. Music receives 9 votes, art 6, coding 6 and chess 3.
| Club | Frequency | Angle |
|---|---|---|
| Music | 9 | 135 degrees |
| Art | 6 | 90 degrees |
| Coding | 6 | 90 degrees |
| Chess | 3 | 45 degrees |
To recover a frequency, calculate angle / 360 x total. The art sector is 90 degrees, so its frequency is 90 / 360 x 24 = 6 pupils. Music takes 135 / 360 = 3 / 8 of the circle, or 37.5%.
Without the total of 24, the angle would tell you only a share. Use the total for this survey, not the 20 pupils in the fruit example. Mixing denominators changes the meaning of every calculation.
Which mistakes should you avoid?
- Using a different total for different categories in one chart.
- Giving overlapping groups separate slices of the same whole.
- Rounding each intermediate fraction before calculating the angle.
Five practice questions
Use the worked examples above. Try the questions before opening the answers.
- What percentage of the fruit votes goes to apple?
- Calculate the sector angle for banana.
- What percentage and angle represent apple and banana together?
- A sector is 90 degrees in the 24-pupil club chart. How many pupils does it represent?
- Why is a pie chart of overlapping club memberships different from the single-choice survey here?
Show answers and working
- 8 / 20 x 100 = 40%.
- 6 / 20 x 360 = 108 degrees.
- Together they have 14 votes. 14 / 20 x 100 = 70%, and 14 / 20 x 360 = 252 degrees.
- 90 / 360 x 24 = 6 pupils.
- A person in more than one club would be counted more than once. Membership totals would not divide the pupils into non-overlapping parts of one whole.
Common questions
Why do pie chart angles add up to 360 degrees?
The sectors divide one complete circle. A full turn is 360 degrees, so the unrounded sector angles must add to 360.
Can I find a frequency from a percentage alone?
You also need the total. Frequency equals percentage / 100 multiplied by the total, subject to any rounding in the displayed percentage.
Printable worksheet and teacher answers
The A4 worksheet contains the two examples, five practice questions with writing space, and a separate answer page. Print pages 1-2 for students and retain page 3 for marking. Suggested time: 30 minutes.
Download worksheet and answers (PDF)Free to print and share for classroom and home learning. All examples use original fictional data and contain no real pupil information.